Welcome Guest

Please complete your name, email, select a question type from the list and enter your message to contact us.

Step 1
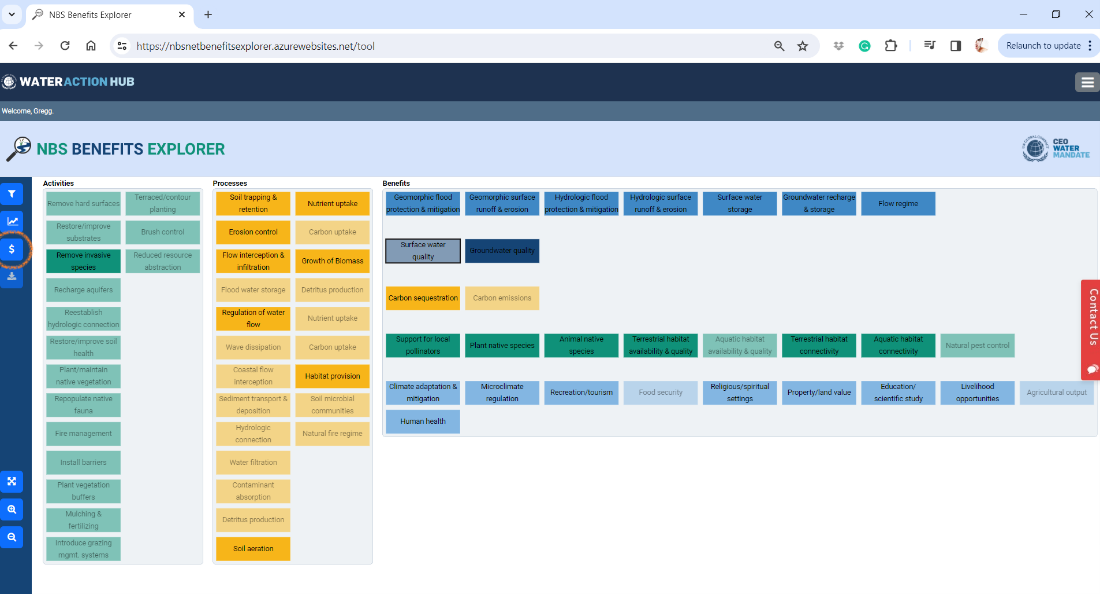
From the dashboard, click the Dollar Sign button in the left blue toolbar to open the valuation window.
Step 2
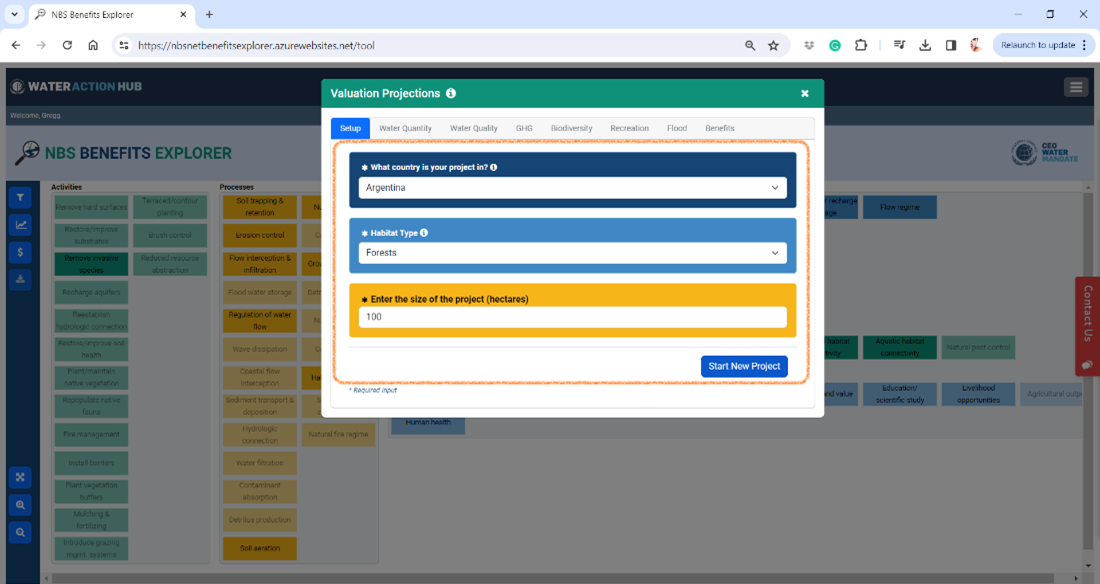
On the first tab of the Valuation Projections window, select a country for your proposed project, a habitat type, and the size. Then click the Start New Project button.
Step 3
Some things to keep in mind before continuing:
By default, the tool will guide you through the valuation process stepwise from left to right. While you can click out of sequence to explore only certain thematic areas, it is suggested to complete the models in the default order for the best experience. To read more about how the model works, click the "model details" link at the bottom of any valuation tab. More details about individual inputs can be found by clicking the “i” icons that may appear next to an input.
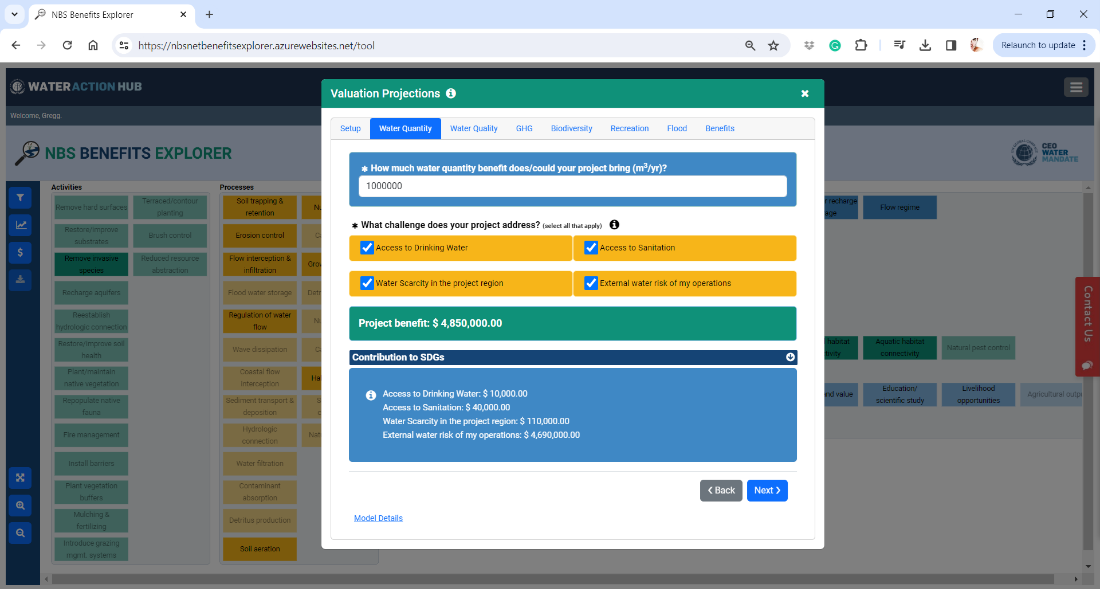
For the Water Quantity valuation model, accept the default volumetric benefit or enter your own value if you have a known specific quantity for the project. Next select at least one item from the four challenges shown and click the Calculate button to see the project benefit. To view a breakdown of how this valuation contributes to the UN Sustainable Development Goals, click the down arrow button on the Contribution to SDGs bar. Click Next to continue.
Step 4
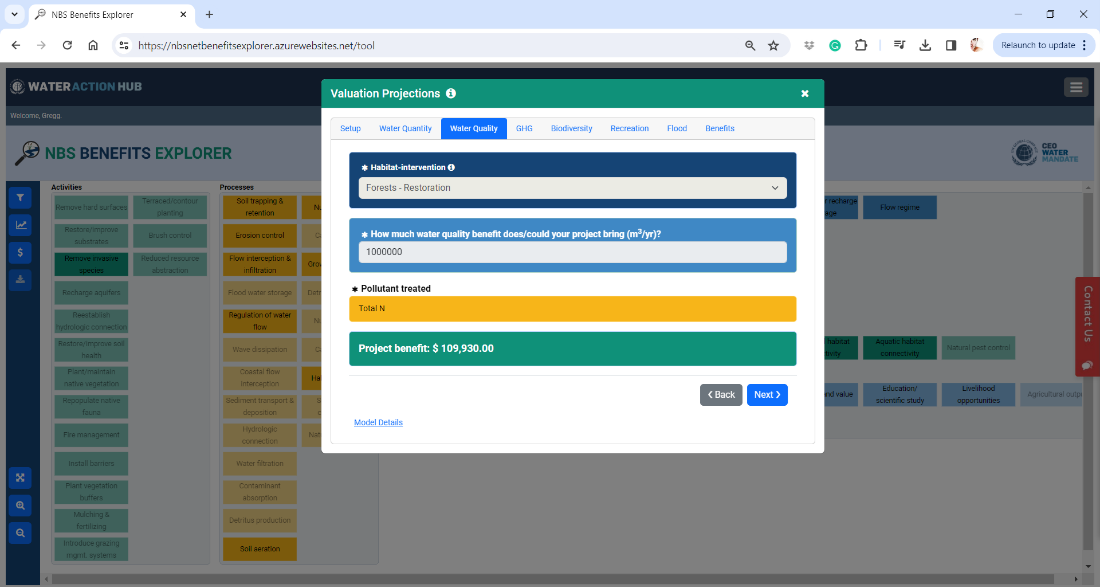
The inputs for the Water Quality valuation model will already be selected based on earlier inputs and no additional inputs are required for this model. These can be changed by the user if different values are preferred. Click the Calculate button to see the project benefit and click Next to continue.
Step 5
The GHG tab uses different models and inputs depending on the habitat type selected in Step 2. To complete this model, follow the sequence for your habitat type below.
Estuaries, Mangroves
There is no GHG sequestration for agricultural habitats and no corresponding project benefit.
Forest, Agriculture, Grasslands, Urban (Forest Model)
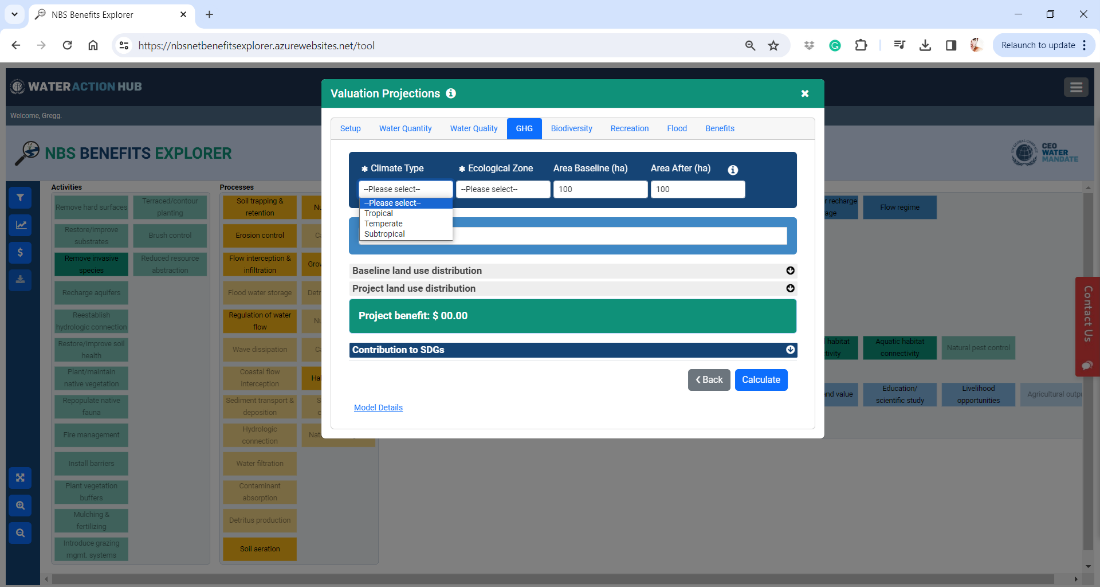
The forest model is the most complex model in the tool and requires many inputs. Each input on the form is dynamic and based on answers to previous inputs, so please select the Climate Type first. The climate types displayed are based on the country selected on the Project Setup tab.
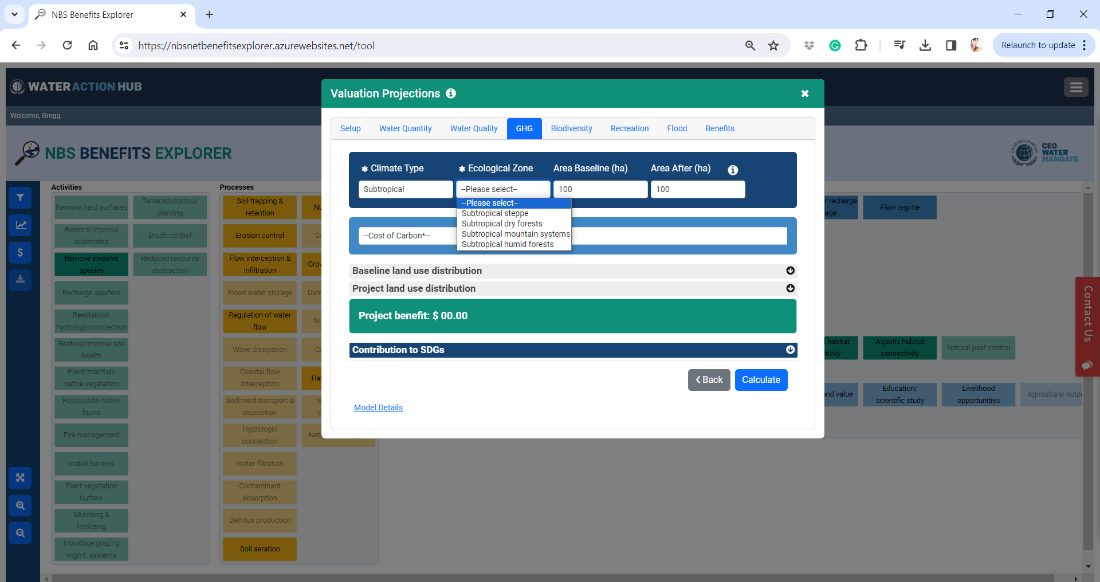
Once a climate type is selected, the model will select the available ecological zones for that climate type. Select a value for the Ecological Zone from the list. The Area Baseline and After inputs are based on the size of the project entered in the Project Setup tab. If for some reason these values differ, please enter a different value for project hectares.
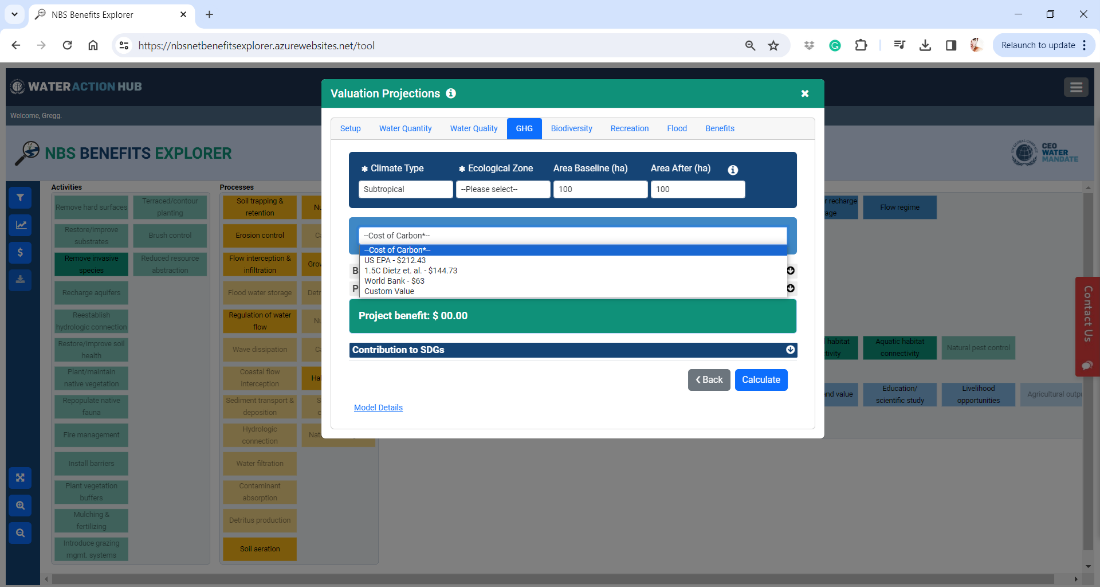
Next select a value for the cost of carbon. The inputs select up until this point will be used to determine available options in the land use distribution inputs, including tree species.
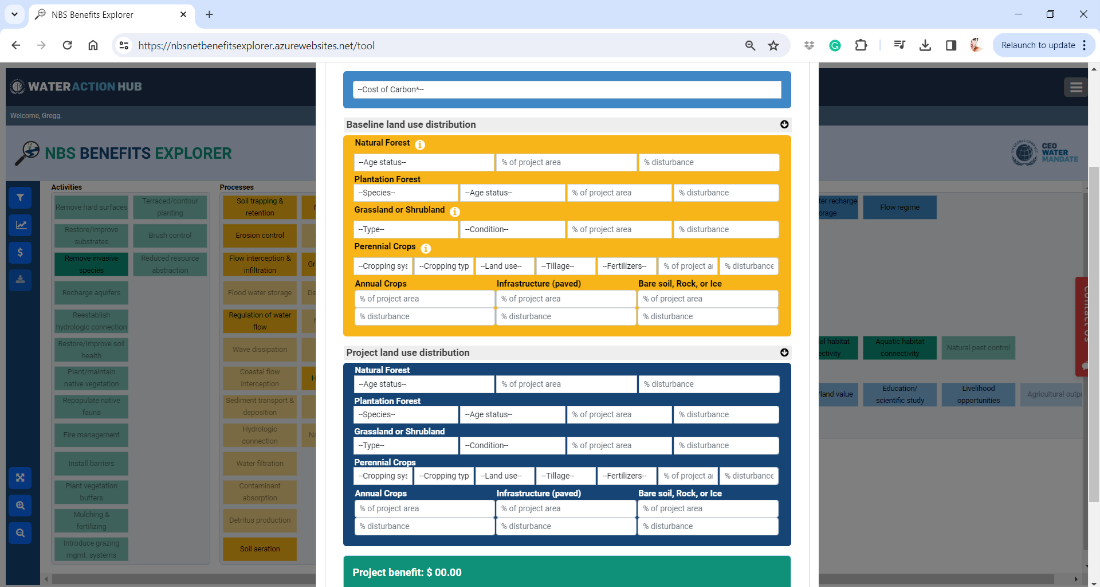
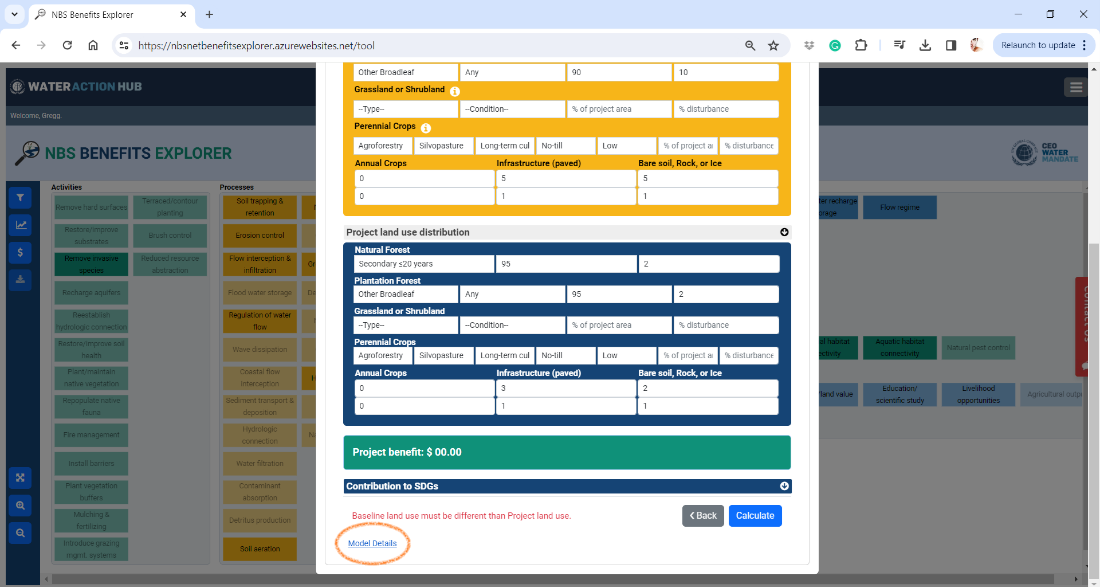
Expand the Baseline Land Use Distribution form using the down arrow on the right. The baseline values should be teh values that exist before the project. While there are a lot of inputs here, not all are required. However, there must be at least one land use type and and the % of Project Area fields entered must sum up to 100%. Input values appropriate for your proposed project and leave all the remaining inputs blank. Next expand the Project Land Use Distribution form using the down arrow on the right. Complete the inputs here using the same methods as the Baseline form.
Once all inputs are complete, scroll down and click the Calculate button. To see the tons of carbon sequestered, click the down arrow on the right of the Contribution to SDGs bar.
Wetland, Rivers and Floodplains (Wetland Model)
For the wetland model, please select a climate zone, a value for vegetation, a value for water table depth, a soil nutrient status, and the value of carbon you prefer. Click the Calculate button to see the project benefit and use the down arrow on the right of the Contribution to SDGs bar to see the tons of carbon sequestered.
Step 6
For all models, click the Next button to continue.
Step 7
The inputs for the Biodiversity valuation model are the simplest in the tool and in most cases the Type of Project will be selected for you based on earlier inputs. Click the Calculate button to see the project benefit and then the Next button to move to Recreation.
Step 8
The Recreation valuation model contains one option for forest habitats and another for wetlands. Depending on your project habitat type, you will be directed to one of the options below.
Agriculture, Grasslands
There is no model for the valuation of recreation benefits for these habitat types in the current version of the tool. Click the Skip button to move to the next tab.
Estuaries, Wetlands, Rivers and Floodplains
For the Wetland Recreation model, the habitat will be pre-selected based on earlier inputs. Select the appropriate type of wetland for your project and click the Calculate button.
Forests, Mangroves
For the Wetland Forest model, first select if your project is in a natural or plantation forest. Next select a value for Protected Area status, and then finally the type of forest for your project. Click the Calculate button to see the project benefit.
Urban
Urban projects can use either the wetland model for perhaps a pond in a city park or the forest model for urban greenspaces. Select Forest or Wetland for the first input. The remaining inputs will change depending on which option is selected.
Urban Wetland
For wetland projects in an urban area, the only other required input is the type of wetland. Select a value from the list. Next click the Calculate button to see the project benefit.
Urban Forest
Forest projects require a few more inputs, including whether it is a natural forest or a plantation forest, protected area status, and finally the type of forest. Next click the Calculate button to see the project benefit.
Step 9
The final model is the Flood Valuation model which estimates the property damage caused by a flood based on flooded land area, flood depth, return period, construction types in the flood zone, and both before and after flood characteristics. Values are pre-populated for this model based on a study conducted in Broomfield, United Kingdom. If you do not know specific values for the flood inputs for your project, you can accept the defaults and click Calculate to get an idea of the project benefit.
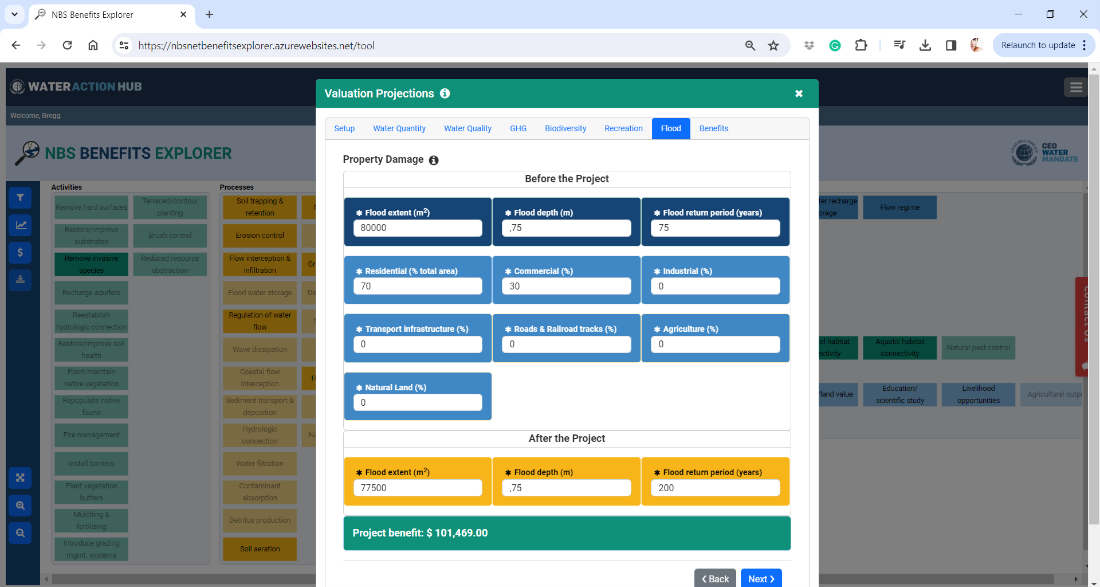
Ideally, the inputs are changed to values that are more suited to your project. Enter the number of square meters of flooded land for both before and after the project. Next enter the flood depth for both before and after the project, and finally the return period of the flood. Finally, enter the construction types within the flooded area as a percent of total flooded area within the listed categories ensuring the total equals 100%. The system will show the total percent entered as you modify the values. While some of these values might be wide ranging estimates or even informed guesses, it is encouraged to experiment with different values. Click the Calculate button to see a project benefit, but before you click Next you can update the values and click Calculate again to see updated results to understand the impact variation on flood depth, return period, and the other inputs have. In this way, the tool can help target flood areas where a project can have the biggest benefit. Tip: try a 100% residential project and compare with a 100% commercial project without changing any other inputs to illustrate this effect.
Once you have entered final inputs for before and after the project, click the Calculate button and then the Next button.
Step 10
The graph that appears on the final screen gives you the overall valuation totals for the project benefits based on the inputs provided to each of the models.
If you would like to save the results either for your own information or to share with colleagues, you can export a PDF at this point. To do so, enter a name for the project and click the Export Results to PDF button. NOTE: The Export to PDF requires a valid Water Action Hub account and that you are logged in. You will be prompted to login to the Water Action Hub if you are not currently logged in.
Step 11
Time to explore the tool more! Click the Start New Project button to clear your project values and estimate project benefit for either another location using the same input values, or perhaps another type of project in the same location. Using the tool this way to model different scenarios can help determine the best location for your project or the type of project that creates the biggest greatest benefits for a specific location.