Welcome Guest

Please complete your name, email, select a question type from the list and enter your message to contact us.

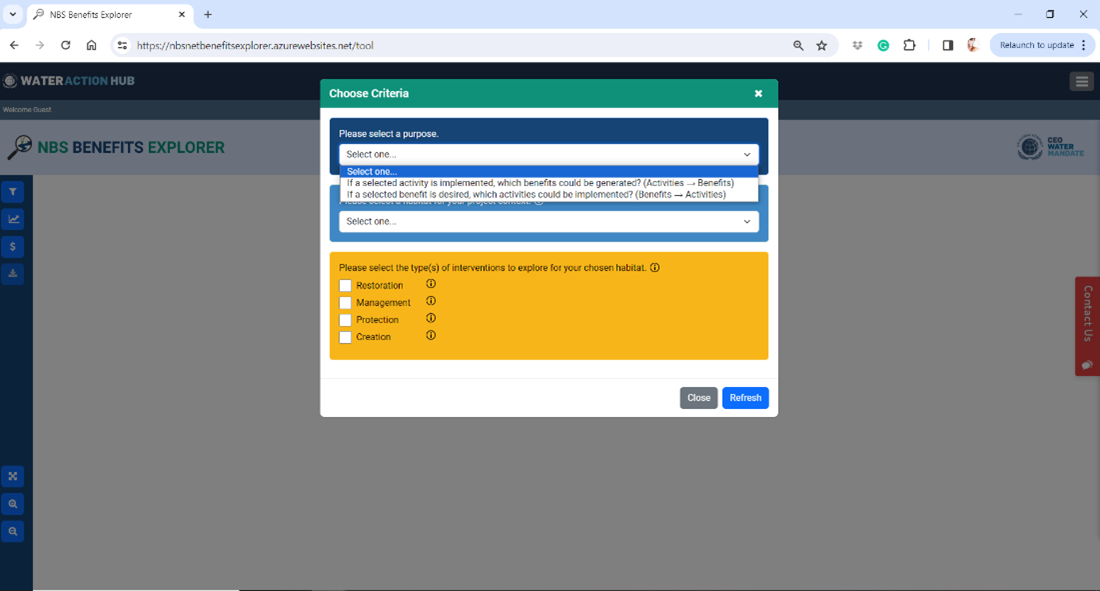
Step 1
Choose a starting point for using this tool based on what you are looking to understand.
You may want to explore which benefits a certain activity will generate (Activities → Benefits) or which activities will achieve desired benefit(s) (Benefits → Activities).
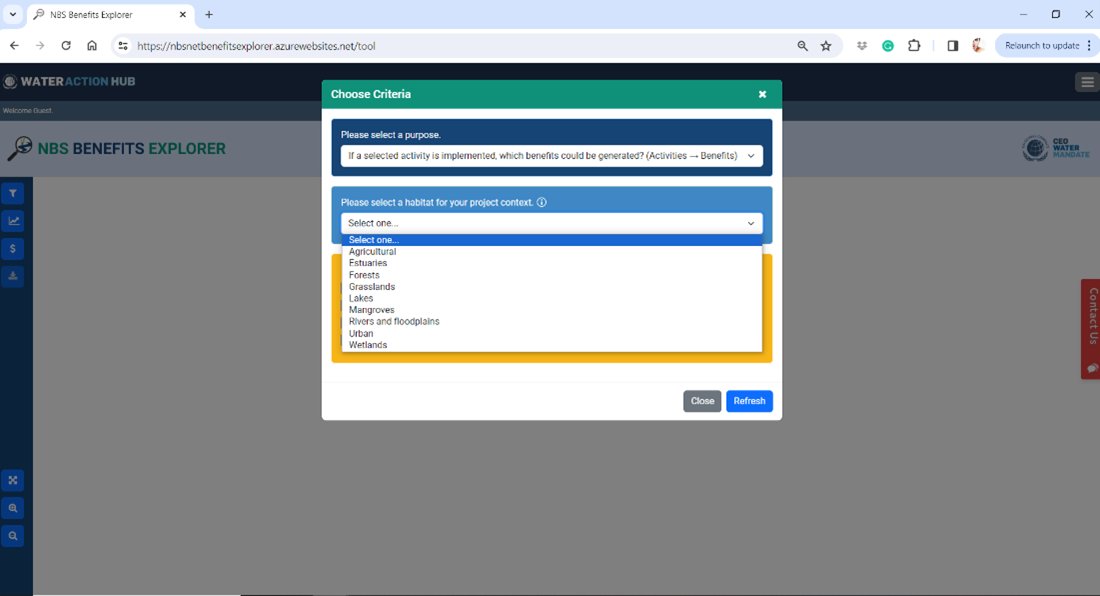
Step 2
Choose a habitat that is relevant to your local project context.
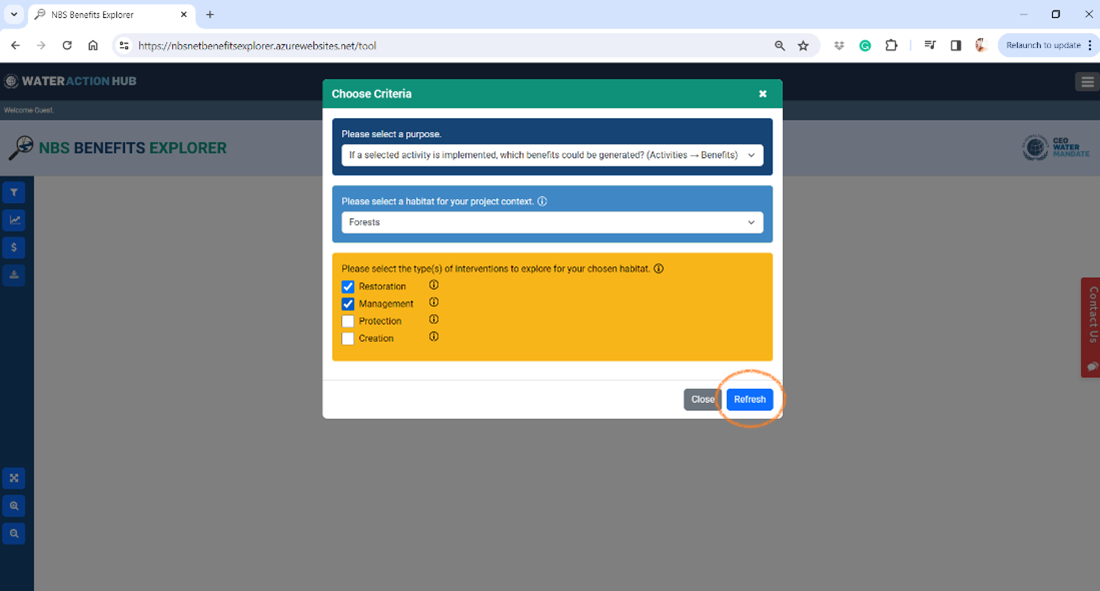
Step 3
Choose at least one type of intervention that is needed in your chosen habitat. Multiple interventions can be selected.

Step 4
Click the Refresh button to view relevant
activities, processes, and benefits in the dashboard.
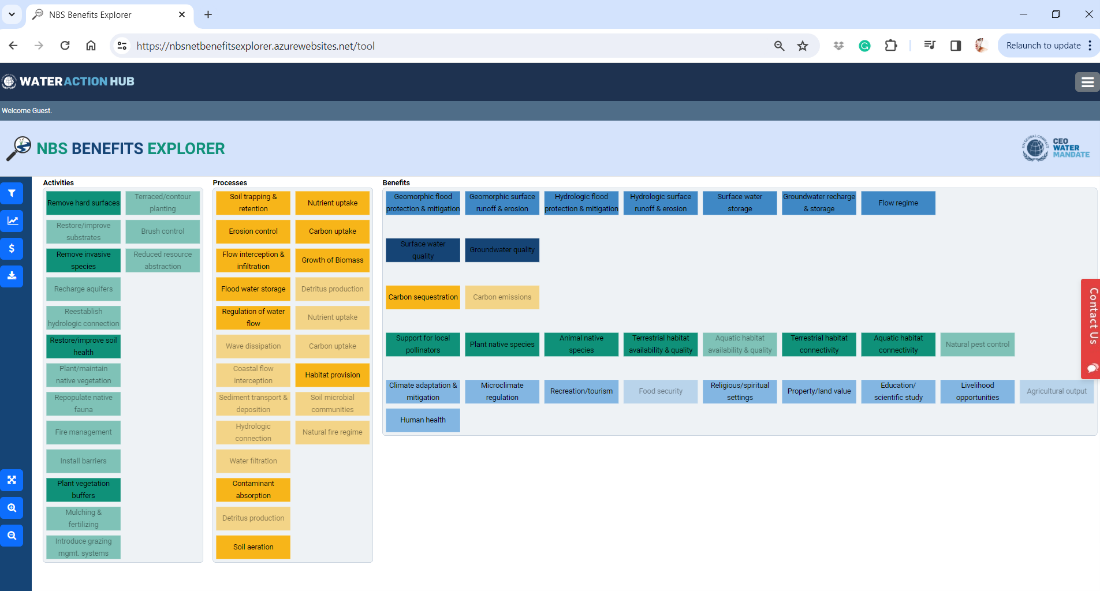
Step 5
Within the dashboard, choose which activities you plan to implement or benefits you want to achieve with your project based on your choice in Step 1 and the mapped benefits will be highlighted. By selecting activities or benefits you will see various highlighted connections across the selected habitat-intervention category.
Step 6
To explore Benefit Forecasts, under the Benefit Forecast heading, click the Graph icon to display the benefit accrual forecast for the selected activity-benefit combination. Please note that not all activity-benefit combinations have a forecast graph.
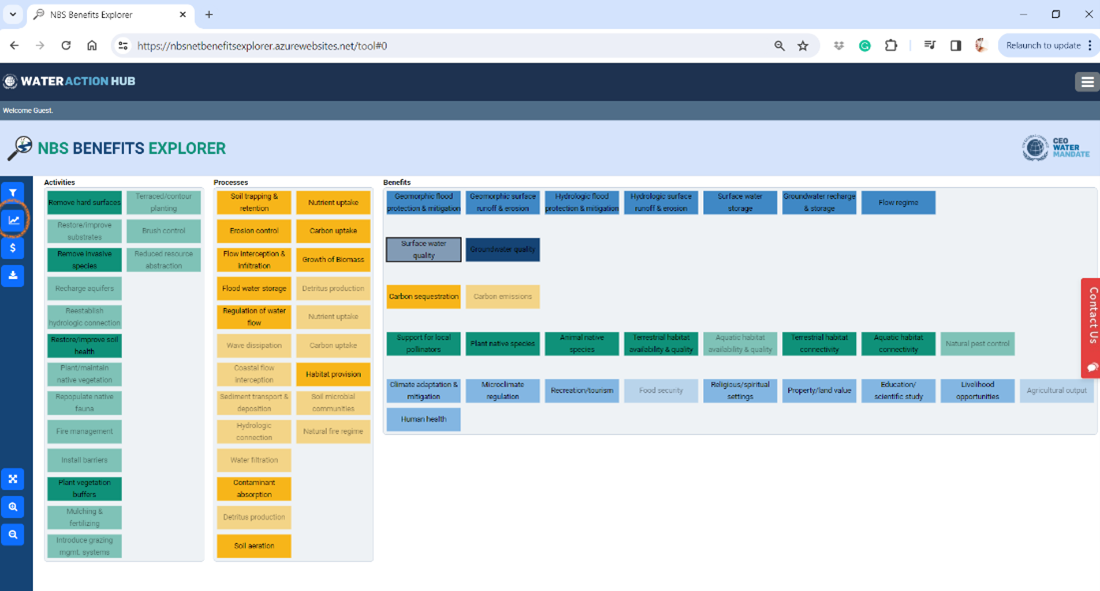
Step 7
A pop-out box will present the benefit forecasts which represent potential benefit accrual estimates (y axis) over time (x-axis).
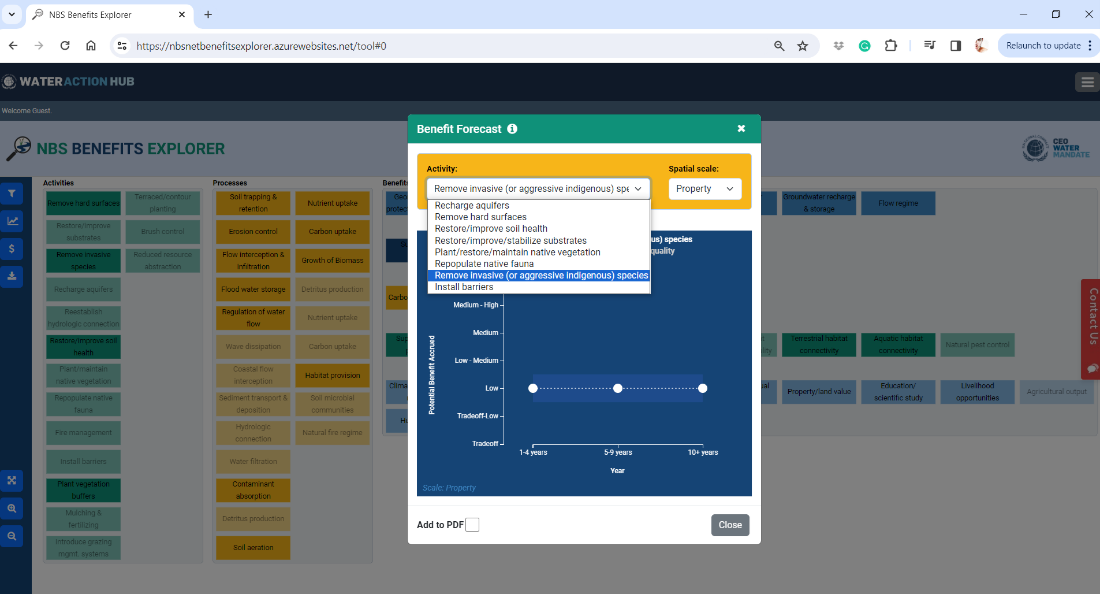
From the Benefit Forecast graph popup window, you can explore multiple activity-benefit linkages by clicking on the dropdown menu.
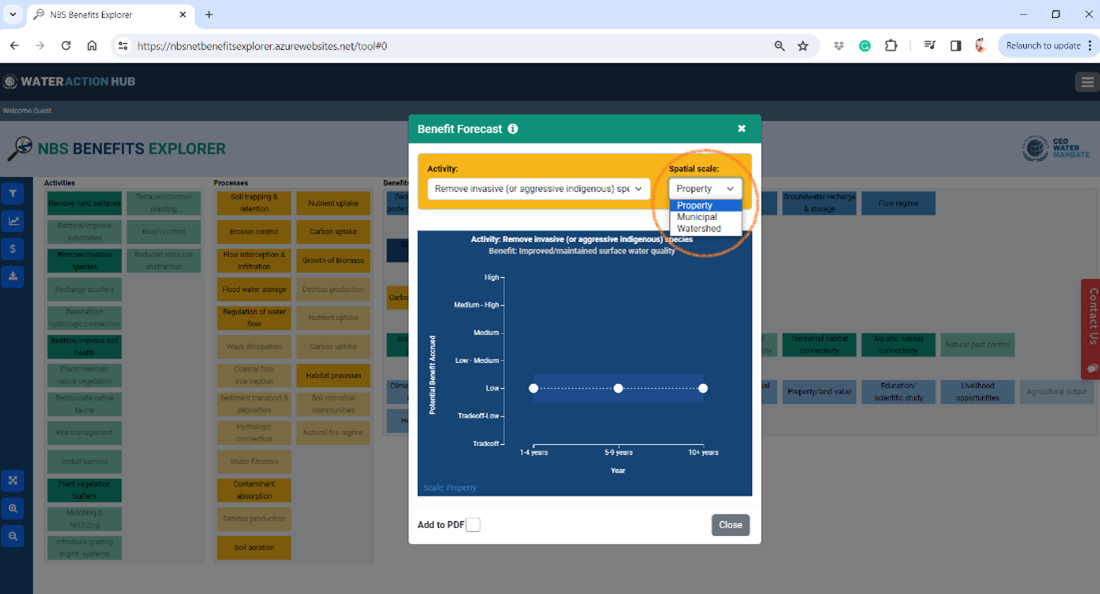
You can also explore spatial scales using the dropdown input in the upper right corner and select either Property, Municipal, or Watershed scale to view benefit accrual across these scales. The temporal scale is indicated across the x-axis in years.
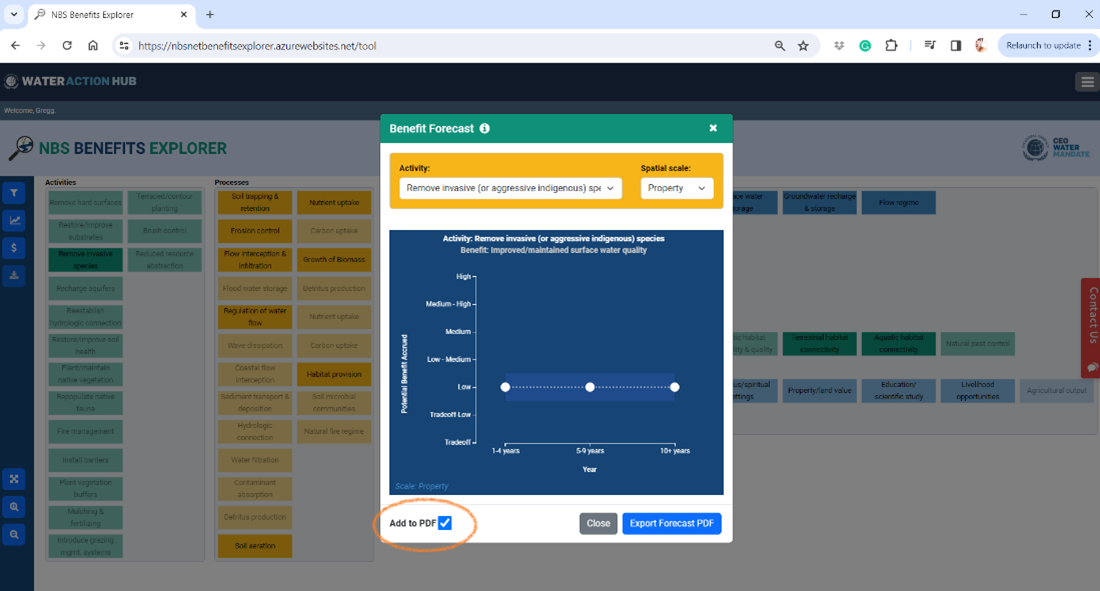
Step 8
To save any benefit forecasts to a PDF for export, use the Add to PDF checkbox in the lower left of the graph window. The export for any activity will include all 3 spatial scales so only use the Add to PDF button once for a given activity.
You can also explore spatial scales using the dropdown input in the upper right corner and select either Property, Municipal, or Watershed scale to view benefit accrual across these scales. The temporal scale is indicated across the x-axis in years.